
Understanding AdSense Performance Reports is the first step toward making smarter decisions for your website. If you want to see which parts of your site are performing well and where you might be losing out, you need to know how to read the data. These reports are not just a collection of numbers; they are a map that shows how visitors interact with your content.
Why Performance Reports Matter
When you first open your reports, the amount of information can feel overwhelming. However, these tools are designed to help you see trends over time. By looking at these patterns, you can figure out what kind of content your audience enjoys and which ad placements are most effective.
Instead of guessing what works, you can use real data to guide your strategy. This helps you focus your energy on the areas that actually bring in results, rather than wasting time on things that do not move the needle.
Key Metrics You Should Know
To understand your reports, you need to be familiar with a few basic terms. These metrics tell the story of your site’s health.
Page Views: This is the number of times a user views a page that is showing ads. Even if you have multiple ads on one page, it still counts as a single page view.
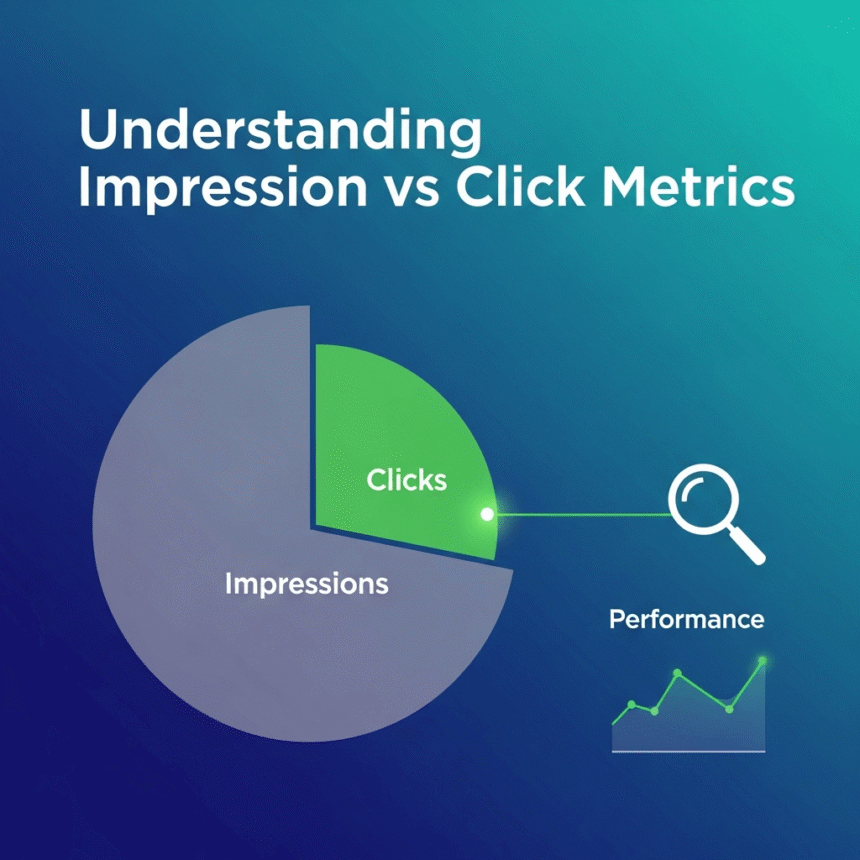
Impressions: This counts every time an individual ad is shown on your site. If a page has three ad units and it is viewed once, you get three impressions.
Clicks: This is a simple count of how many times visitors actually clicked on an ad.
CTR (Click-Through Rate): This is the percentage of impressions that resulted in a click. It is calculated by dividing clicks by total impressions.
RPM (Revenue Per Mille): This represents your estimated earnings for every 1000 impressions or page views. It is a great way to compare the performance of different sections of your site.
Navigating the Report Types
The dashboard offers several ways to look at your data. Each report gives you a different perspective on your performance.
The Sites Report
If you manage more than one website, this report is essential. It allows you to see which domain is performing the best. You might find that one site has a much higher engagement rate than another, which can help you decide where to invest more of your content creation budget.
The Ad Units Report
This report breaks down performance by the specific ad blocks you have created. It helps you identify if a sidebar ad is doing better than one placed inside your articles. If certain units are underperforming, you might consider moving them or changing their size.
The Countries Report
Geography plays a big role in how ads perform. The Countries report shows you where your visitors are located. You might notice that visitors from certain regions interact with your site differently. This information is helpful if you want to tailor your content to a specific audience.
How to Use Filters and Breakdowns
One of the most powerful features of these reports is the ability to filter data. You can narrow down your view to look at specific dates, platforms (like mobile versus desktop), or ad formats.
For example, if you notice a sudden drop in performance, you can use filters to see if the drop happened only on mobile devices. If it did, there might be a technical issue with how your site loads on phones. Breakdowns allow you to organize your data into categories, making it easier to spot these kinds of patterns.
Improving Your Strategy with Data
Once you understand the reports, you can start making changes. If your CTR is low, you might need to experiment with different ad placements. If your Page RPM is high on certain topics, you should consider writing more articles about those subjects.
Regularly checking your performance reports ensures that you stay on top of any changes in visitor behavior. It allows you to be proactive rather than reactive.